
The Leaseurope Index report for the fourth quarter of 2012 has shown a slight improvement in all weighted average ratios, year-on-year, except cost/income.
Indicators were, however, down on Q3 2012, according to the European leasing trade body’s survey of 17 companies across the continent, including captive asset finance providers, fleet lessors and bank-owned independent finance houses.
Go deeper with GlobalData


Access deeper industry intelligence
Experience unmatched clarity with a single platform that combines unique data, AI, and human expertise.
This, the eighth edition of the Index, highlighted the drop in indicating ratios across 2012, compared to 2011 levels, which Leaseurope attributed to the strong performance of H1 2011.
Total leasing new business volumes were down 10.8% year-on-year for the quarter to 17.66bn and down 14.3% to 66.92bn for the entire year.
The total portfolio of outstanding contracts was down 0.9% at the end of the quarter and the year, worth £232.34bn, while risk-weighted assets were down 3.3% for the quarter and 3.0% for the year to £174.57bn, leading the trade association to believe lessors are favouring lower-risk assets.
Income and profits
Despite some companies recording substantial losses in the quarter, total pre-tax profit for the companies in the survey dropped only 0.3% to 321m, compared to drops of 17.7% in Q3 and 32.7% in Q2, all compared to the respective quarter of 2011.
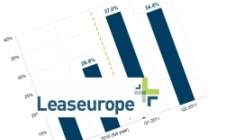
Average profitability ratio increased to 16.3% in Q4 2012, from 14.7% in Q4 2011, but was down to 26.5% across 2012, from 29.8% across 2011
Operating income was up 0.6% on Q4 2011 but by less than operating expenses, up 5.3%, pushing the cost/income up to 53.5%, from 52.9% in Q4 2011 and 47.9% in Q3 2012, making Q4 2012 the only quarter in the year to have a higher cost/income ratio than the annual average of 48.3%, also up on 2011’s figure of 47.7%.
Despite loan loss provisions reaching their highest point for 2012 in the fourth quarter, the figure was down 4.0% on Q4 2011. Cost of risk for the quarter remained at 0.9% compared to the same period in the previous year, with average annual cost of risk up slightly from 0.6% in 2011 to 0.7% in 2012.
Returns
Return on assets (RoA), the average of all companies’ net profit as a percentage of average portfolio, weighted by average portfolio, stood at 0.6% in Q4, the same level as 2011. For the year, RoA was 0.9%, down from 1.0% in 2011.
Return on equity (RoE), the average of all companies’ net profit as a percentage of 8% total risk weighted assets, also weighted by average portfolio, was 8.5% for the quarter, up from 8.3% in Q4 2011, and 14.7% for 2012, down from 16.7% in 2011.
Leaseurope added the caveat that RoA and RoE figures could be swayed by companies outside the median field, and that, if the lowest and highest 25% of company figures were removed, the median value of the ratios for a "typical" firm would be 1.1% RoA and 21.2% RoE.
richard.brown@timetric.com