

Amidst shifting global supply chain dynamics, the demand for efficiency and risk tolerance is at an all-time high. The New York Fed’s Global Supply Chain Pressure Index has receded, signalling a potential surplus in the system. To navigate this landscape, companies are turning to graph database technology, a powerful tool designed to reveal intricate relationships within vast datasets.
In 2021, due to COVID lockdowns and blockages in the Suez Canal, the world faced an unprecedented supply chain crisis, with goods locked up in ports and shortages in many components.
Go deeper with GlobalData

Access deeper industry intelligence
Experience unmatched clarity with a single platform that combines unique data, AI, and human expertise.
Now, we have a different supply chain headache. The New York Fed’s Global Supply Chain Pressure Index, designed to monitor supply chain stress, has fallen to pre-pandemic levels, and we may arguably have too much slack in the system.
The danger of over-supply may have subsided, but what global commerce now craves is not only efficiency but increasingly risk tolerance. Shipping and logistics companies want to know they can always route around costly, hard-to-predict disruptions or have alternate sources for critical components. Brands would love to have the capacity to adapt their supplier network to deal with rapidly changing customer demands. In the midst of rising interest in everything from Greener shipping to increasing calls for Scope 3 transparency and ethical sourcing, it’s clear that business leaders need as much insight into what’s really going on in the world’s central economic ‘artery’ as they can get.
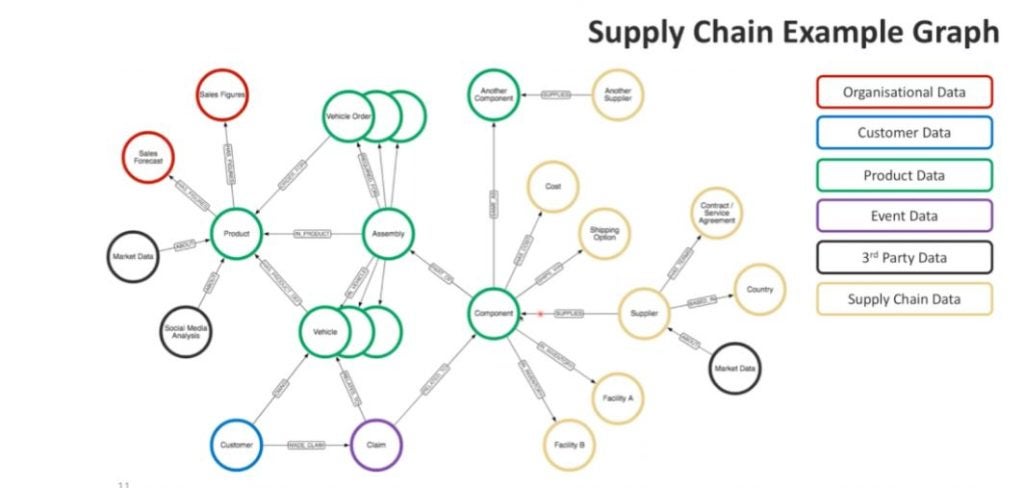
Emerging as a new tool to help deliver all of the above is graph database technology. Graph databases deliver much more than a standard tabular database- they are architected from their outset to be able to reveal relationships and patterns in vast, deeply interconnected datasets that originate in disparate systems. And this turns out to be precisely what supply chain modernisation requires.
The best way to see how this works is to look at a real-world example. Global procurement services firm Scoutbee offers some of the world’s largest businesses an easy way to gain insights into their supplier networks and supply chains. As a result, Scoutbee manages enormous data volumes, at times handling real-time data from 10 or more ERP systems.
But there’s clearly a difference between being able to compile a large supply chain dataset and extracting any insight from it. Scoutbee used a knowledge graph (a specific implementation of graph database with an emphasis on contextual understanding) to connect the dots within the data and bridge gaps between the data and its customers’ business vocabularies. As a result, it offers an interlinked set of facts describing real-world entities, events, or things and their interrelations in a human- and machine-understandable format.
Neo4j technology enables Scoutbee to create knowledge graphs that business users and other non-technical supply chain stakeholders, as well as more specialized data scientists and engineers, can use. The Scoutbee platform, which uses graph technology and predictive and prescriptive analytics, is also helping procurement practitioners make confident supplier decisions, drive cross-functional efficiency, and optimise their existing technology investments.
The firm’s customers report supplier discovery is now 75% faster, while supply chain management processes that used to take 100 to 180 working hours over 24 weeks are now slashed to more like 8–12 hours over six. In times of bottleneck or the need to rapidly adapt to a new reality, such a capability is the difference between delivery, delay, or worse.
The ability to leverage all available data on a supplier, create visualizations of supplier interdependencies, and select the optimum partner at any moment is powerful. However, it’s just one example of how much graph technology in supply chain modernisation is moving the needle. That’s because of the profound shift away from a less flexible way of working with data — a traditional tabular database approach — to graph technology which can analyse very large volumes of data in milliseconds.
Getting answers in real time
To begin with, graph databases excel at modelling complex supply chains with high fidelity. They make it easy to model recursive relationships, for example, so they’re ideal for managing suppliers that extend beyond tier 1 into tier 2 and even tier 3. There’s a huge performance advantage running queries across data this way compared to a traditional relational database approach. Unencumbered by tabular ‘JOINs’ and indexes across rows and columns, graph databases offer rich, interrelated datasets, regardless of the scale of the data.
That means supply chain optimisers can query where to source alternative parts or find customer orders, and get answers in real-time; find the most critical components in their supply chain or find unused or seldom used parts or predict restocking intervals. Users are discovering that due to being flexible by design, graph databases quickly adapt as supply chains evolve. That means your managers can easily add data classes and entities when introducing products or product categories while accommodating new suppliers. It becomes simple, with no need to refactor applications or the data platform.
The truth is that while supply chains have evolved into complex digital supply networks, supply chain management systems have not kept up. It’s time to see how the new set of data tools graph technology offers could deepen your understanding of supply chain structure and improve decision-making areas, from strategic planning to day-to-day operations.
Evaluating graph technology before the next stranded container ship in a critical pinch-point in the transport network reverses our supply chain state of equilibrium or critical parts needed for a best-selling product were inadvertently used for another product. Such an event could push a company into a crisis that could have been avoided with a fresh approach to managing business flow.
Navneet Mathur is Senior Director of Global Solutions at Neo4j, a graph database and analytics company. A longer version of this discussion is available in this Neo4j whitepaper, How Graph Technology Drives Modern Supply Chain Strategy, available here.